Drought. It's something that impacts everyone but I feel like a lot of people don't know what drought is or what it implies. Drought is simply the absence of water. The absence of water has impacts on crops, water supply, commodities and, of course, humans. This week's drought monitor was just released and it's not looking good for many.
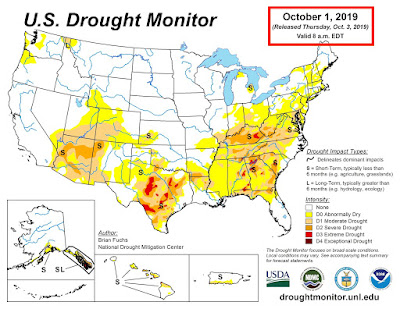 |
| October 1 Drought Monitor Map |
This map shows that just under 40% (39.41%) of the Continental US is 'abnormally dry' or in the D0 category as set by the USDA, NOAA, NDMC and the University of Lincoln, Nebraska. Just under 20% (19.81%) of the country is under a moderate drought (D1 category). Just under 6% (5.95%) is experiencing severe drought (D2 category) and under 1% (0.79%) of the country is under severe drought (D3 category) and that is growing.
 |
| US Drought Monitor as of September 3, 2019 |
The map above is from one month ago when there was noticeably less drought across the East Coast and across the Four Corners region. Notably, Texas has also seen a rather impressive increase in drought over the last month. A stubborn high pressure over the southeast is to blame for the remarkable lack of rain. Meanwhile, a lack of monsoon rains in the southwest is to blame for the growing drought concerns there. Something to note when concerning drought is that is can begin rapidly and it can end rapidly. All it will take is a very good moisture-rich storm system to bring drought concerns down. That is unfortunately not in the books.
 |
| Amount of rain, as compared to normal, expected through October 13. |
The map above depicts the amount of rain as compared to normal that is expected over the next ten days. Greens/blues depict where above-normal precip may fall and browns/reds depict where below-average precipitation will fall. If you look at the Four Corners region, the southeast and Texas, those areas are likely to experience more drought based on this model.
I want to section off areas of the country that are experiencing this drought. First, the southeast.
 |
| Yearly rainfall in Columbia, SC. |
This graph shows the amount of rain that has fallen in Columbia, SC since the beginning of this year. The blue line denotes the highest yearly rainfall, the red line is the lowest rain ever recorded, the brown line is normal and the green line is the actual rainfall this year. Notice that at almost all points this year, Columbia has been below normal in terms of rainfall and even more notably, they haven't seen measurable rain in over 2 weeks.
 |
| Amount of precipitation that exceeds normal or is below normal for the time period |
So, here's a zoomed-in view of the Southern Appalachians. Positive numbers (shown in greens and blues) are where precipitation should occur that is higher than what would normally happen during this time period. Negative numbers (shown in browns and reds) show where there will be a lack of rainfall as compared to normal for this period. This is not good news for drought concerns as this amount of rain, or lack thereof spells bad news for crops and water levels in reservoirs and dams. They will most likely see an increase in drought coverage.
Let's head out West.
 |
Amount of precipitation that exceeds normal or is below normal for the time period
|
|
Here's the same map as above but for the intermountain west. In almost every area (except New Mexico) will see blow-normal precipitation through the 13th of October and if you reference the map above concerning drought conditions currently, this spells bad news for drought concerns. The West has been the central talk around drought because of how severe, how long-lasting and how impactful it typically is. We all hear of the wildfires out west and that is a growing concern. There are already several fires burning and with this forecast of below-average rain, there will be either more fires that spark or the concern of fires starting and growing rapidly.
Since I'm currently living in Denver, Let's look at Colorado's current drought.
 |
| Almost 70% of Colorado is currently Abnormally Dry (D0 category) |
There was one point this summer that Colorado has no drought anywhere in the state and when that happened earlier this year, it was the first time Colorado has had no drought anywhere in the state EVER. Simply put, there has never, not been drought conditions somewhere in the state, up until this year. That has quickly ended.
 |
| Rainfall normals in Denver |
This chart shows that Denver is actually above normal in the precipitation department but just because we've seen more rain than normal in the realm of a water year, doesn't mean we can't have drought conditions. Take a closer look at this chart, in particular, the green line. Denver hasn't really seen much precipitation since mid-August... Yes, there was a little bump in early September but largely over the last 1.5-2 months, Denver hasn't seen much rain at all. And this is when we start to worry.
 |
| What Drought means for Colorado, based on category. |
So, in the D1 category, wildfires increase. That is already happening has there are several fires burning in Colorado. D1 category also signifies that ski season is limited because of the lack of precipitation, or snow. Drought impacts are so much more than what you would typically think and each state is impacted differently. We'll have to watch this very closely because, unless the overall weather pattern changes, we'll start seeing some big concerns come up because of the lack of rain.
One last thing, heat is also something that impacts drought. Hot weather makes water evaporate and even though a lot of water is stored in the ground, extended heat and sunshine are a big contributor to drought. With that said, check this out.
 |
| Places in the US that recorded a record warm September |
The map above shows every location that recorded record warmth during the month of October. Every orange and red block denote areas that had the top 10 warmest September's on record. That's a lot of red showing up...and you can almost directly correlate the record warmth to where drought is happening and/or growing.
Pay attention to drought. It signifies a lot more than what you would normally think.
~Rain or Shine
I'm Andy Stein


Comments
Post a Comment